
Running a Shopify store isn’t just about tracking revenue — it’s about understanding what actually drives your profit.
That’s why we’ve just released a powerful new feature in Netlyze – Profit Tracking: Customize Metrics.
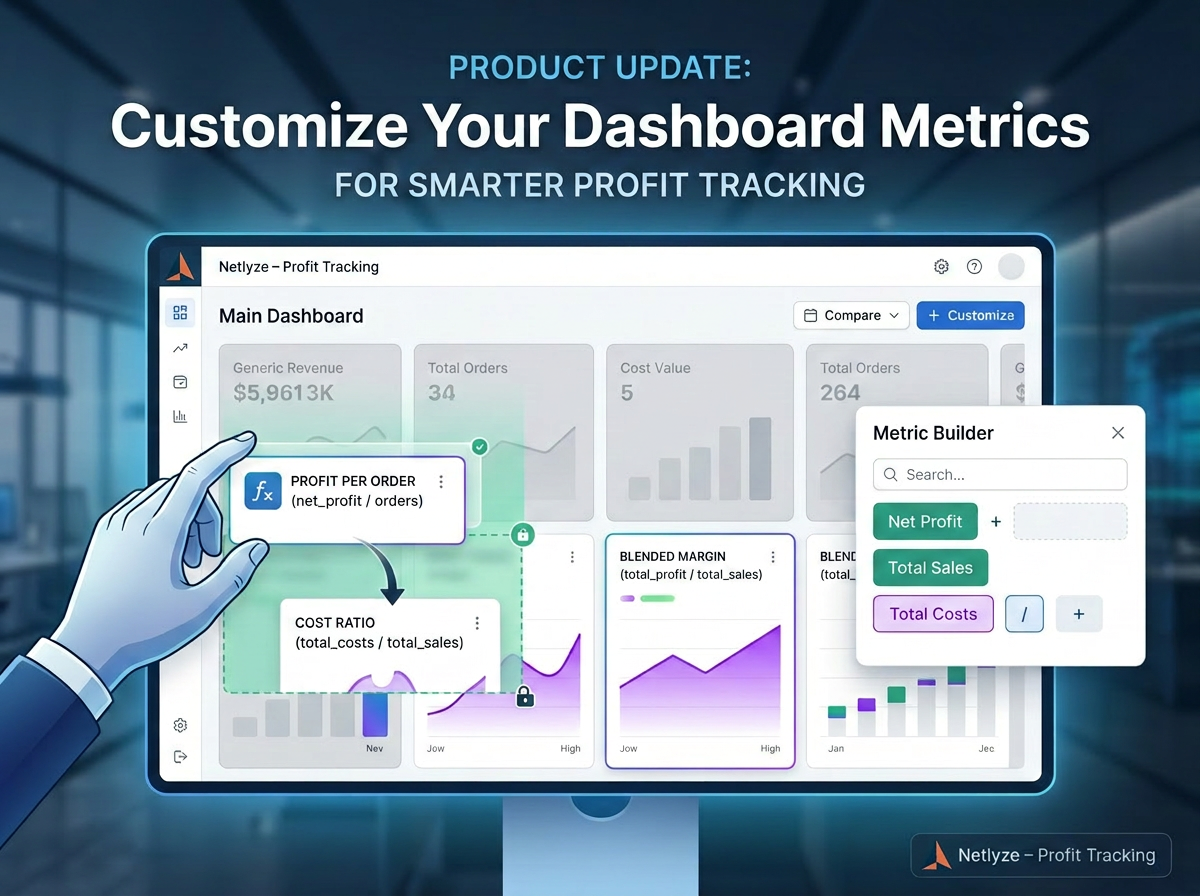
Now, you’re no longer locked into a fixed dashboard. You can decide exactly what metrics to track, how they’re calculated, and how they’re displayed.
🚀 What’s New
With this update, your dashboard becomes fully flexible — tailored to your business, not the other way around.
- ➤ Choose which metrics appear on your dashboard
- ➤ Reorder metrics based on your workflow
- ➤ Remove unnecessary or distracting data
- ➤ Create custom metrics using your own formulas
In short: You control your numbers now.
📊 Why This Matters
Most Shopify apps show the same generic metrics: revenue, orders, maybe profit.
But every store operates differently.
Some care about profit per order. Some care about cost efficiency. Others care about blended margins.
A fixed dashboard can’t solve that.
That’s exactly the gap this feature fills.
Instead of adapting your business to the tool, Netlyze adapts to your business.
🧮 Build Your Own Metrics
The highlight of this release is the ability to create Custom Metrics.
You can define your own formulas using existing data like:
- ✔️ Net Profit
- ✔️ Total Sales
- ✔️ Total Costs
- ✔️ Orders
- ✔️ Ads Spend
Example metrics you can create:
- ➤ Profit per Order = net_profit / total_orders
- ➤ Cost Ratio = total_costs / total_sales
- ➤ ROAS (basic) = total_sales / ads_spend
No spreadsheets. No manual calculations. Everything updates automatically with your data.
⚙️ Designed for Real Operators
This feature isn’t about adding more data.
It’s about removing noise.
We’ve seen too many merchants overwhelmed by dashboards filled with numbers they don’t use.
With Customize Metrics, you can:
- ✔️ Keep only the KPIs that matter
- ✔️ Align your dashboard with your decision-making
- ✔️ Focus on profit, not vanity metrics
Because in the end, clarity beats complexity.
💡 Practical Use Cases
1. Dropshipping stores
Track true profit after COGS + shipping + fees, and monitor profit per order.
2. Scaling brands
Measure cost efficiency and margin trends across campaigns.
3. Data-driven operators
Build custom ratios that match internal reporting logic.
📈 From Revenue to Real Profit
Revenue is easy to see. Profit is harder to understand.
And the difference between the two is where most Shopify stores lose money.
Customize Metrics is another step toward our core mission:
👉 Help you see real profit — clearly and instantly.
🎯 What’s Next
We’re continuing to expand how you analyze profit:
- → Deeper product-level analytics
- → Better ad spend attribution
- → More automation in cost tracking
But it all starts with one thing: Seeing the right numbers.
Try It Now
Head to your dashboard → click Customize Metrics → and build your own view.
Once you try it, you won’t go back to generic dashboards.
Netlyze – Profit Tracking
See your real profit. Make better decisions.